HIV GAG Demultiplexing
- PacBio sequence HIV GAG (1.5kb) donor for 10 transmission pairs: - And multiplex 10,5,4,3 samples on one chip... to keep us on our toes. - Demultiplex, estimate consensus, and compare against singleton runs. Next ================================Three multiplex
- Cluster, break into three, estimate subcluster consensus, align to singleton consensus.
+----------+----------------------------+-----------+-----------------------------------+
|subcluster|hit |concordance|errors (mismatch, delete, insert) |
+----------+----------------------------+-----------+-----------------------------------|
|1 |2450423-0019.both-Emory_Gag3| 99.7577 | (2,1,1) |
|2 |2450423-0017.both-Emory_Gag1| 99.6981 | (4,0,1) |
|3 |2450423-0018.both-Emory_Gag2| 99.7585 | (4,0,0) |
+----------+----------------------------+-----------+-----------------------------------+
- RESULT: Run -0008 is a mix of Emory_Gag1, 2, and 3. Correct by the
run table! There are order 4 discordances across 1.6kb to the
singleton estimated consensus.
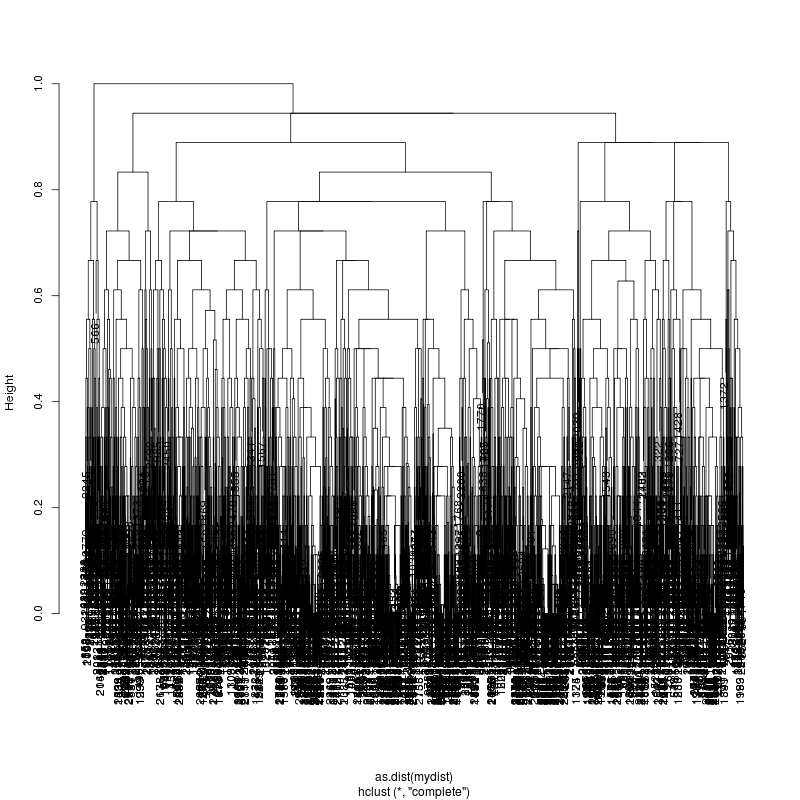
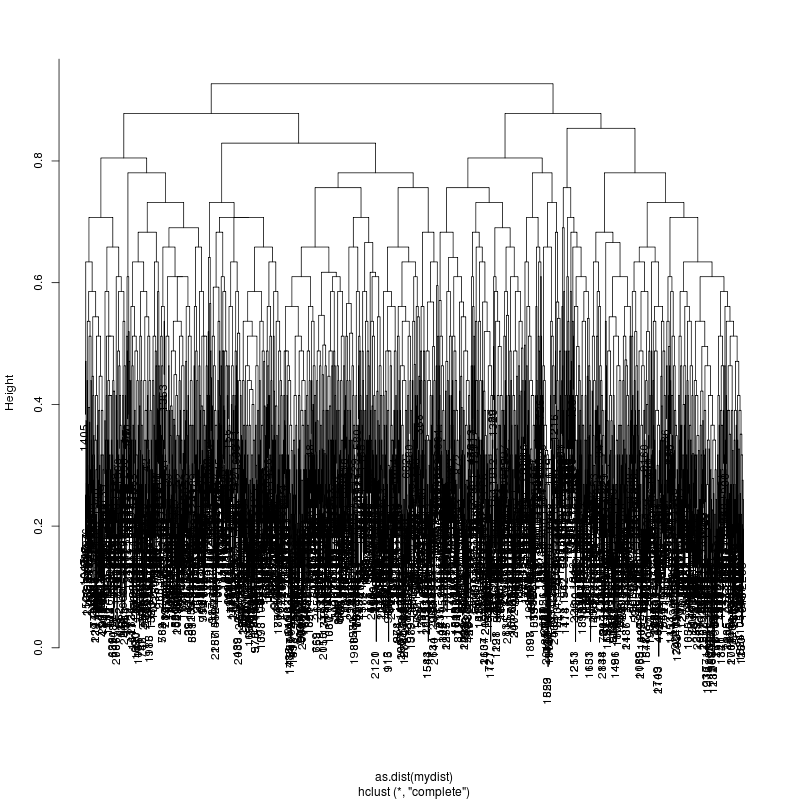
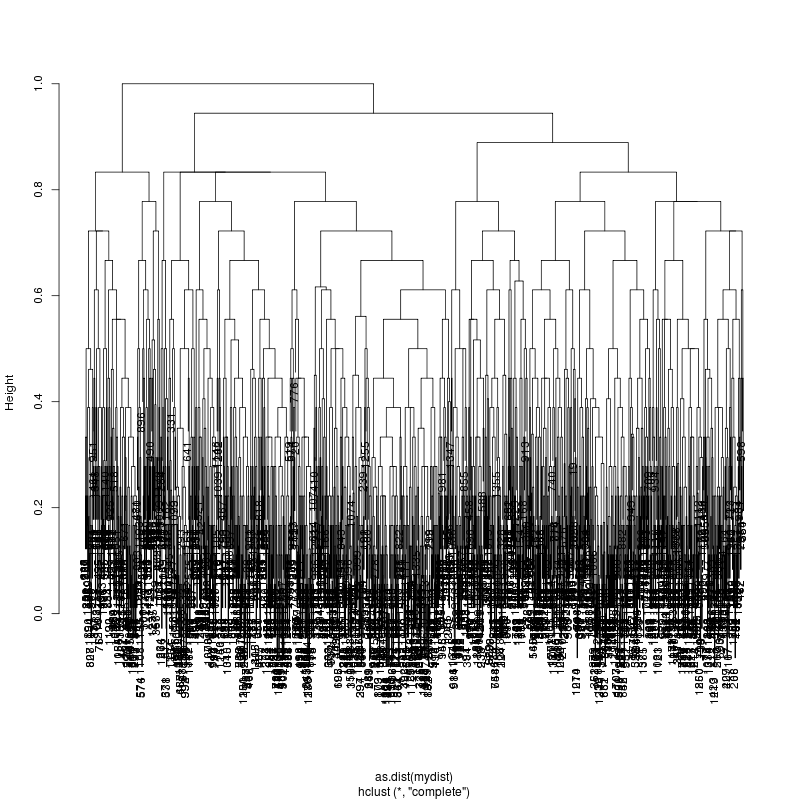
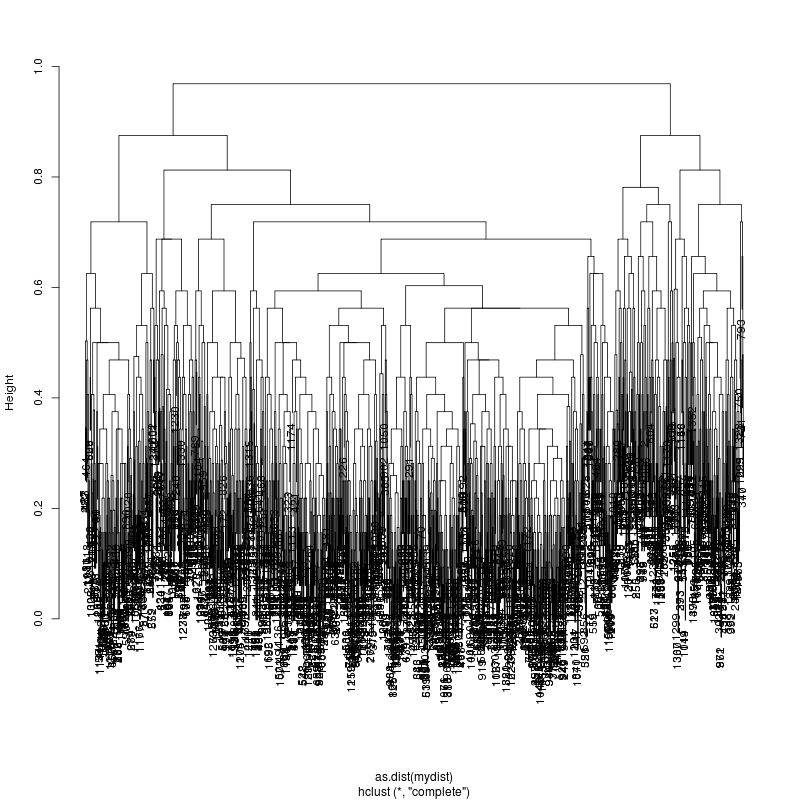
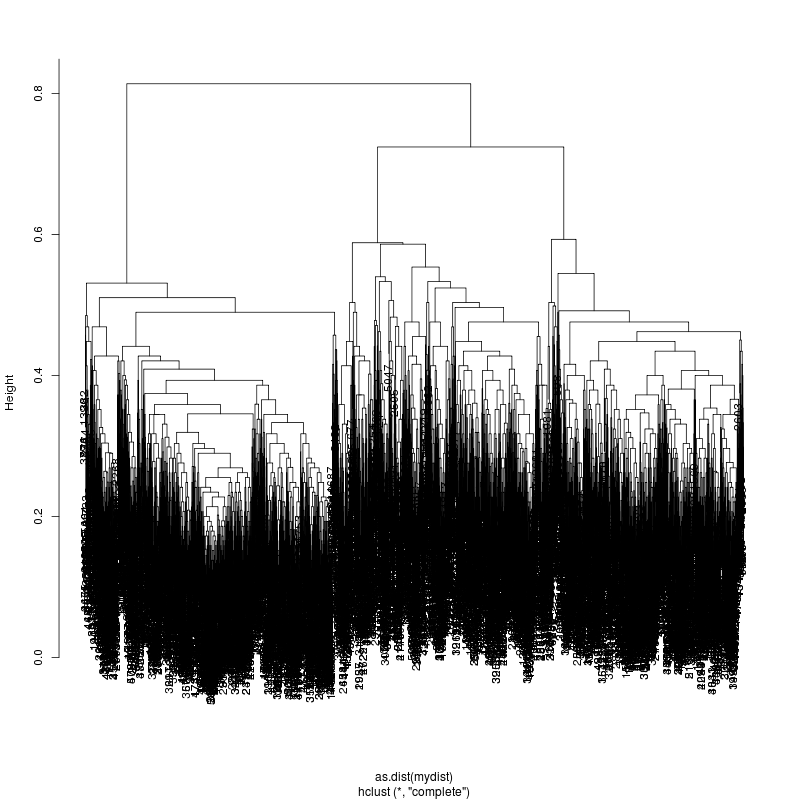
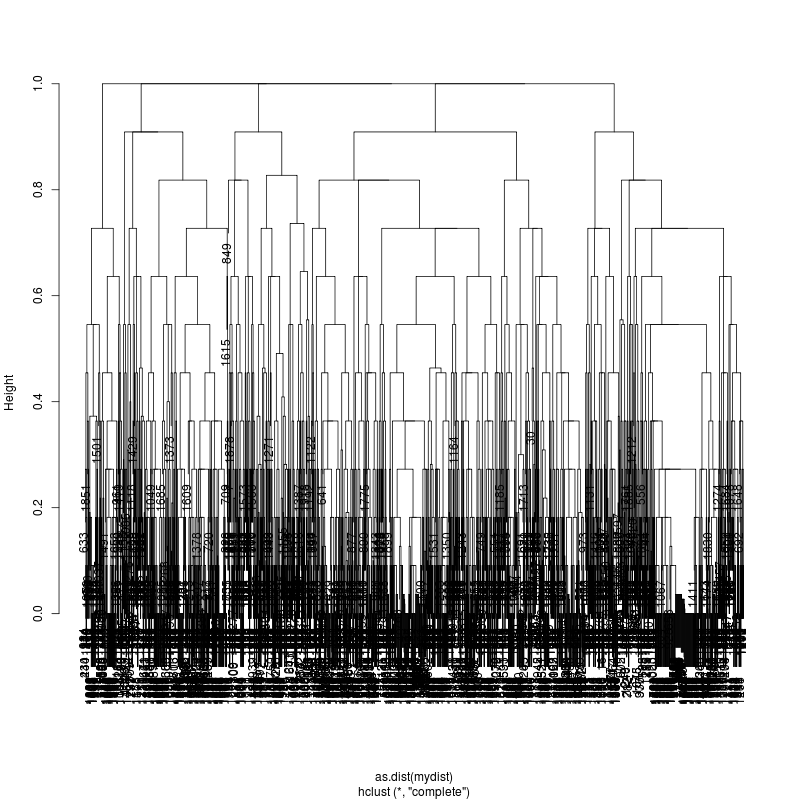
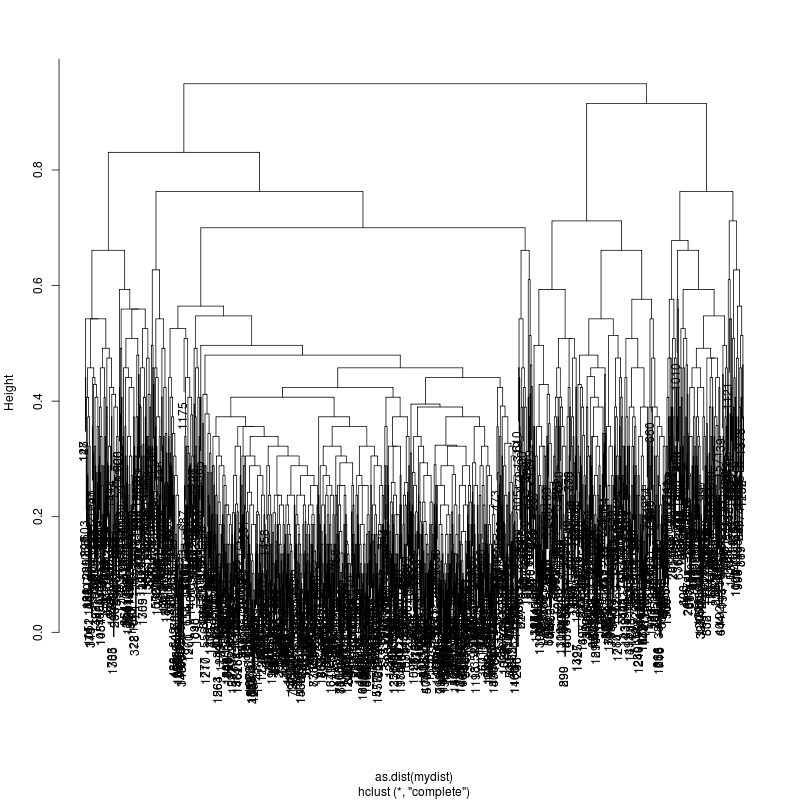
- Look at resulting cluster plots
Original:
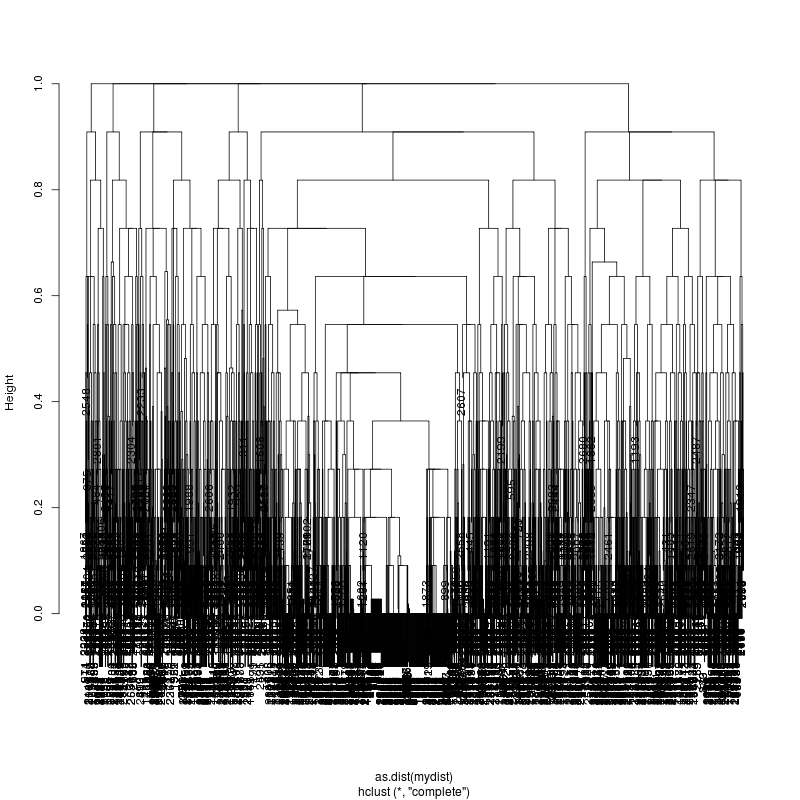
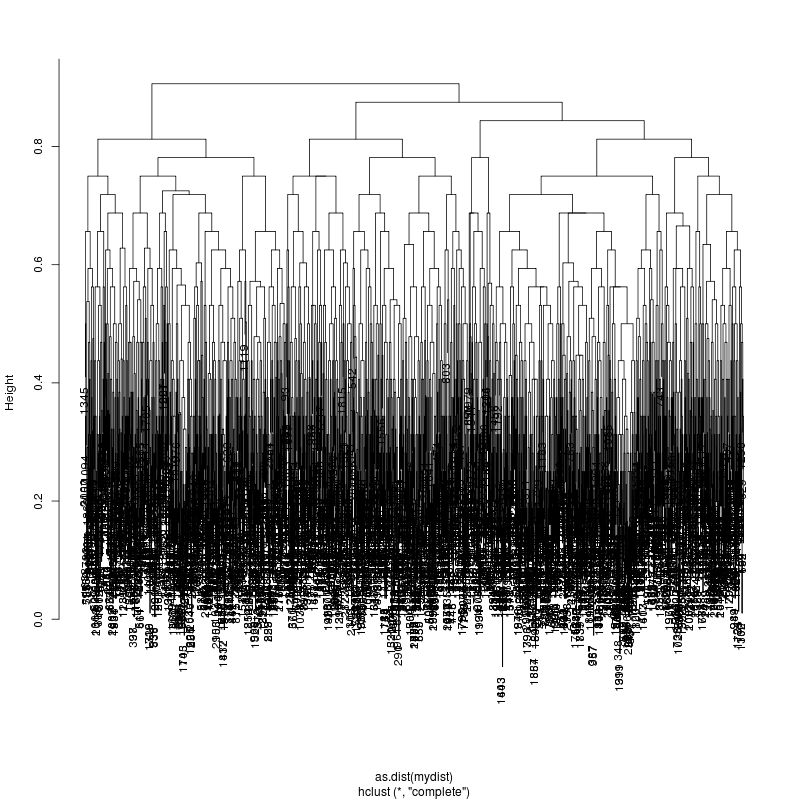
 Look at the subcluster clusters with variant features 11, 59, 39:
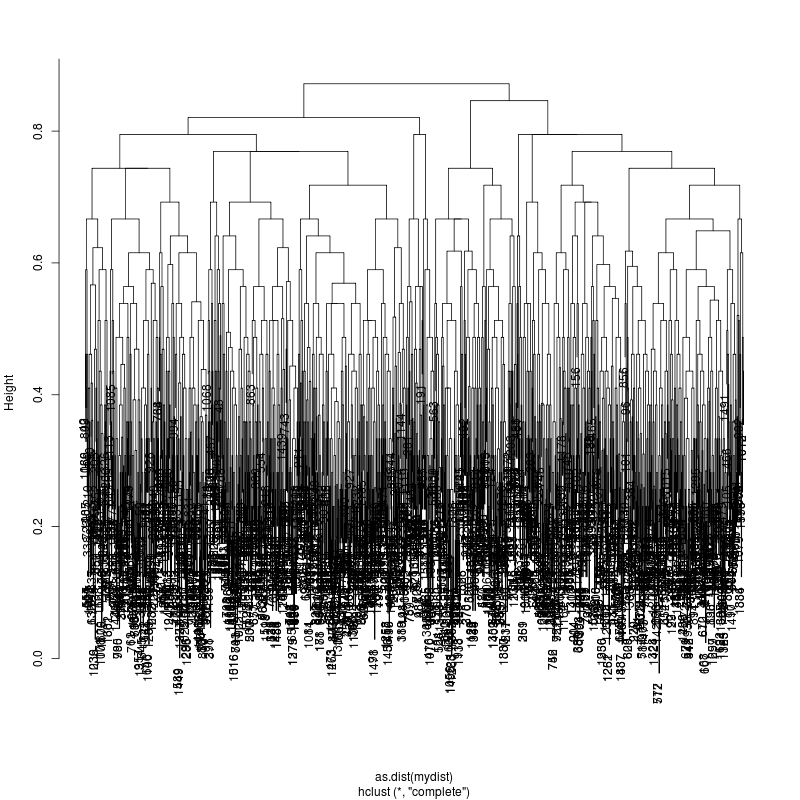 - This could be the within patient variation. The consensus variants
might be just subsampling to a "minor" variant that is close to
abundance to the "major" variant.
Next
================================
- This could be the within patient variation. The consensus variants
might be just subsampling to a "minor" variant that is close to
abundance to the "major" variant.
Next
================================
Ten multiplex
- Cluster, break into ten, estimate subcluster consensus, align to singleton consensus.
+---------------------------------------------------------------------------------------+
|subcluster|hit |concordance|errors (mismatch, delete, insert) |
|----------+----------------------------+-----------+-----------------------------------+
|1 |2450423-0001.both-Gag-9 | 99.5131 |(0,1,7) |
|2 |2450423-0019.both-Emory_Gag3| 99.8182 |(3,0,0) |
|3 |2450423-0021.both-Emory_Gag5| 99.8788 |(2,0,0) |
|4 |2450423-0017.both-Emory_Gag1| 99.6981 |(4,0,1) |
|5 |2450423-0018.both-Emory_Gag2| 99.7585 |(4,0,0) |
|6 |2450423-0023.both-Emory_Gag7| 99.7567 |(4,0,0) |
|7 |2450423-0024.both-Emory_Gag8| 99.8177 |(1,1,1) |
|8 |2450423-0020.both-Emory_Gag4| 99.5737 |(6,1,0) |
|9 |2450423-0002.both-Gag-10 | 99.8181 |(1,2,0) |
|10 |2450423-0002.both-Gag-10 | 100 |(0,0,0) |
+----------+----------------------------+-----------+-----------------------------------+
- Emory_Gag6 is missing and two mapped to Gag-10 (one is
perfect). Almost perfect mapping with 99.8% concordance.
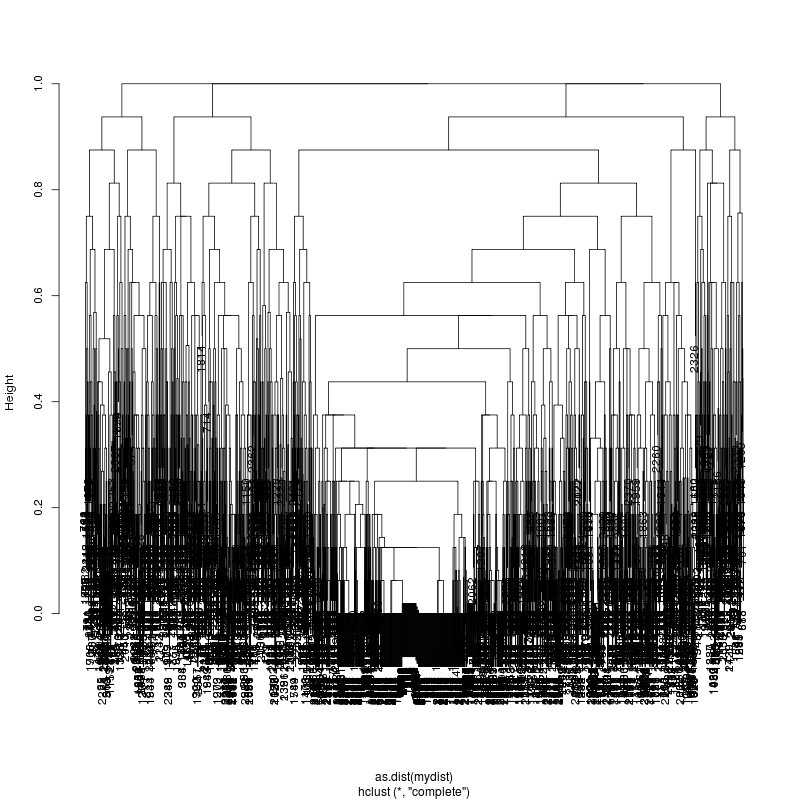
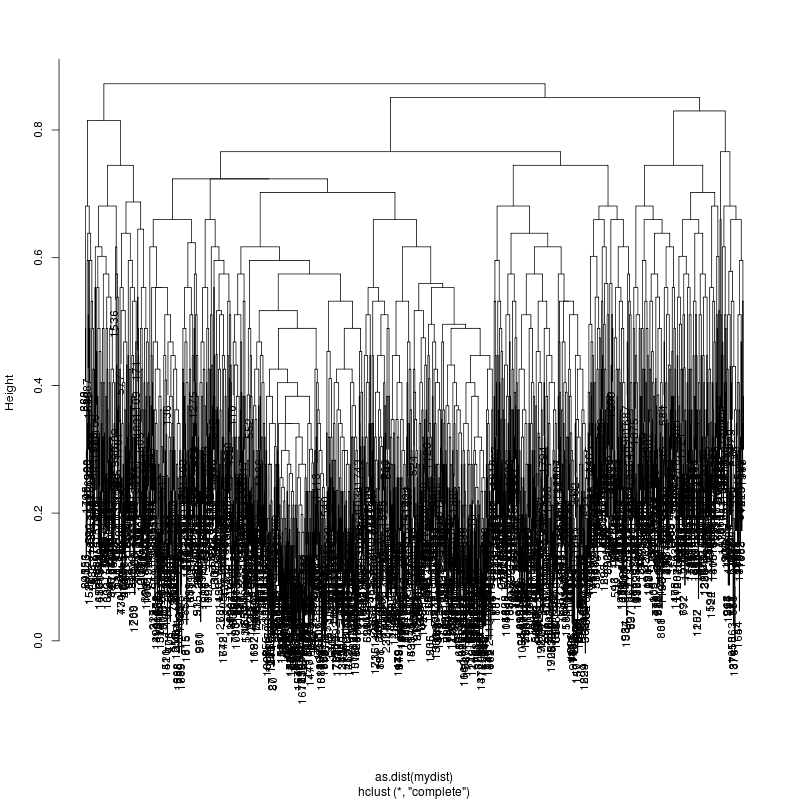
- The subcluster plots:
Original:
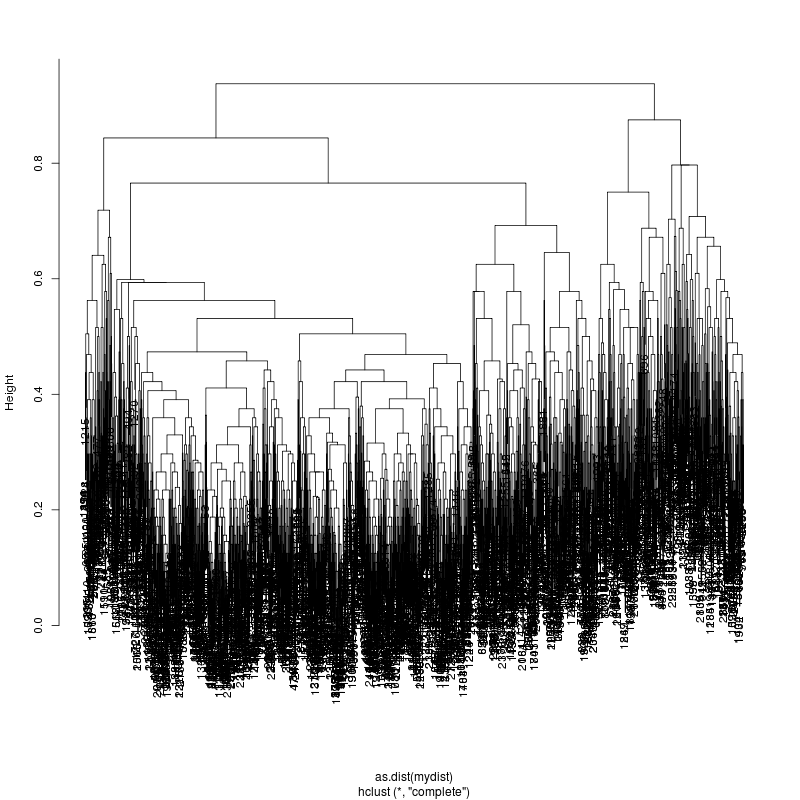
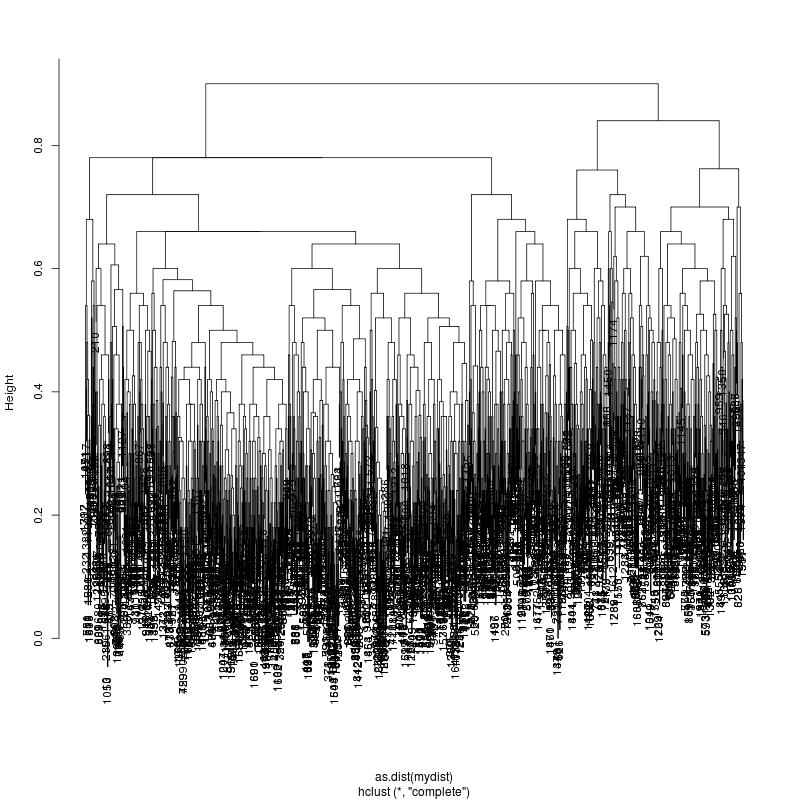
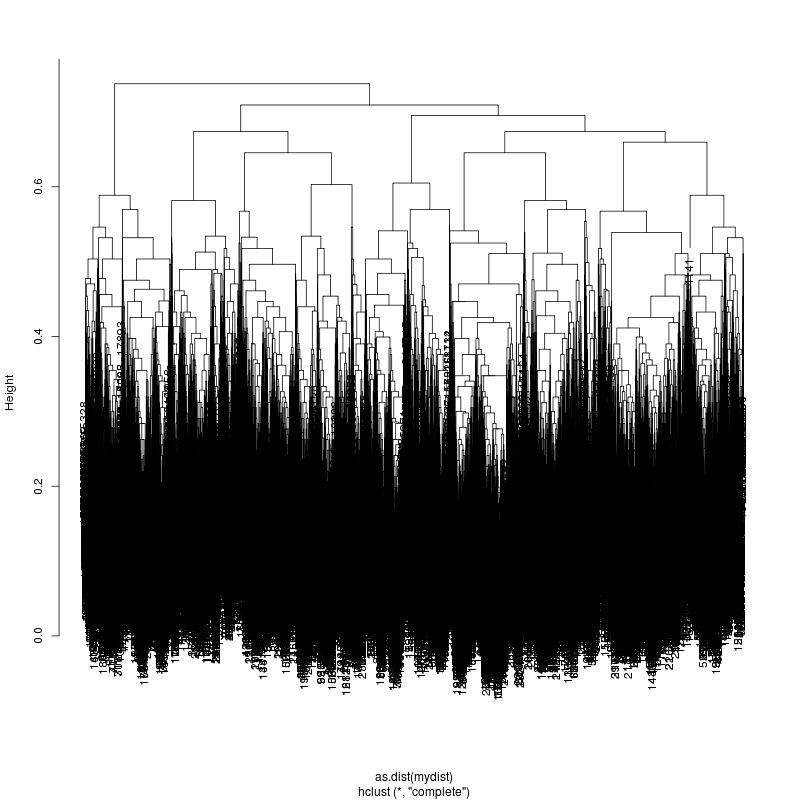 Look at the subcluster clusters with variant features ?,?,?...