goal
goal: summarize results of BCR-ABL variant finding on a larger number
of barcoded patient samples.
summary
- METHODS: Sequence 862 base region of kinase domain from BCR-ABL
using nested PCR followed by barcoded PacBio RS sequencing for 54
clinical samples from 36 CML patients. Look for amino acid variants to
the reference sequence. Run two chips for technical repeats, although
all results only examine one chip at a time. The PacBio RS sequences
continuous single molecules spanning the entire region.
Here is workflow overview bcrablWorkflow.pdf
- 106 known SEQUENCING variants. PacBio finds all of them. A threshold
of 6e-08 would give all of the sequencing mutations with no false
negatives. knownmutsSEQ.merge.tsv
- 131 known SEQUENOM variants. PacBio finds all of them. A p-value
threshold of 1.03e-03 would give all known sequenom mutations with no
false negatives. knownmutsSEQUENOM.merge.tsv
- Note that the stricter p-value of 6e-08 would miss 8 SEQUENOM
variants (that have p-values >6e-08 but <1.03e-03).
- Taking the more strict pvalue threshold of 6e-08, I see 485 novel
variants (327 non-silent) that occur in BOTH technical repeat
chips occurring with abundances 0.2% to 86.15%. novelPacBioVariants.tsv.xls
- We can tell when mutations occur together in compound mutations and
sort by frequency, bcrabl.compoundvariants.runs20-21c24-37.tsv.xls
- We can identify compound mutations at early time points at low
levels that eventually dominate, suggesting early clinical
intervention strategies.
samples, runs, and barcodes
We ran 54 samples in duplicate. Patient SampleIDs were barcoded and
run. The run table is: map2.tsv
Barcode yields are summarized:
limsid thresh ccsnum barcodenum barcodeYield barcodeHitNames barcodeHitCounts
2450177-0020 25 36722 29990 0.816676651598497 F0 F1 F2 F3 F4 F6 3172 3756 2787 9906 3185 7184
2450177-0021 25 37465 30593 0.816575470439077 F0 F1 F2 F3 F4 F6 3159 3809 2855 10238 3287 7245
2450177-0024 25 22911 17812 0.777443149578805 F0 F1 F2 F3 F4 F5 F6 F7 1187 1374 1898 5502 2669 1640 1723 1819
2450177-0025 25 22382 17575 0.785229202037351 F0 F1 F2 F3 F4 F5 F6 F7 1160 1463 1824 5301 2670 1613 1763 1781
2450177-0026 25 21233 16909 0.796354730843498 F0 F1 F2 F3 F4 F5 F7 5215 1167 1528 3010 1182 3818 989
2450177-0027 25 22824 18270 0.800473186119874 F0 F1 F2 F3 F4 F5 F7 5381 1362 1621 3241 1355 4191 1119
2450177-0028 25 17554 14646 0.834339751623562 F0 F1 F2 F3 F4 F5 F6 F7 F8 1588 1917 1601 1110 2301 2395 1887 1846 1
2450177-0029 25 19417 16104 0.829376319719833 F0 F1 F2 F3 F4 F5 F6 F7 1813 2162 1709 1241 2421 2586 2041 2131
2450177-0030 25 17045 12845 0.753593429158111 F0 F1 F2 F3 F4 F5 F6 F7 2437 2576 2175 2900 299 356 902 1200
2450177-0031 25 17290 13003 0.752053209947947 F0 F1 F2 F3 F4 F5 F6 F7 2449 2698 2221 2911 290 330 880 1224
2450177-0032 25 19790 15977 0.807326932794341 F1 F2 F3 F4 F5 F6 2436 2523 2047 1461 4905 2605
2450177-0033 25 19487 15870 0.81438907989942 F1 F2 F3 F4 F5 F6 2390 2524 2042 1426 4826 2662
2450177-0034 25 17284 14822 0.857556121268225 F0 F1 F2 F4 F5 F6 F7 1412 3990 1525 1847 1972 2389 1687
2450177-0035 25 20820 17708 0.850528338136407 F0 F1 F2 F4 F5 F6 F7 1677 4775 1844 2351 2290 2771 2000
2450177-0036 25 12859 10474 0.814526790574695 F0 F1 F2 F3 F4 3925 1879 1263 2391 1016
2450177-0037 25 12341 9997 0.810064014261405 F0 F1 F2 F3 F4 3890 1693 1134 2216 1064
Looks decent with ~80% yields, ~15k barcode reads per chip, sample
coverage 300 to 10,240 aligned reads. -0028,29 contains one false F8
barcode call. -0030,31 contains errant F4.
known variants
We were given a list of known variants by other technology (sequencing
and sequenom): Mutations by seq and MA 130612_Rev.xlsx
I cleaned this into two normalized tables:
knownmutsSEQ.norm.csv
knownmutsSEQUENOM.norm.csv
The headers are:
"key": run.barcode variant key for joining tables
"SampleID": your patient SampleID
"TestGroup": a pacbio run group
"PtInitials": your patient initials
"CollDate": your collection date
"Muts": your variant
"Frac": your estimate of fractional abundance
"runbc": pacbio run.barcode
"one": analysis flag
"poi": amino-acid position of interest.
"coi": codon of interest at poi in the reference
"Qcodon": query codon. the variant
"fracNull": the fraction of the variant seen in the null control run
"countNull": the number of times the variant is seen in the null control run
"SNull": the sum total of observations in the null control run at that position
"fracQAtP": the fraction of the variant seen in the sample
"countQAtP": the number of times the variant is seen in the sample
"SQAtP": the sum total of observations in the sample at that position
"pval": fisher exact test of sample counts to null counts: ((countQAtP, SQAtP),(countNull,SNull))
"mutation": the variant
"limsID": pacbio run id
"barcode": pacbio barcode
"Sample.ID": your patient SampleID
theshold estimate
In order to set an appropriate threshold to separate noise from true
variant results, I joined the known variants by the PacBio variant
estimates. A more stringent threshold of 6.0e-08 was chosen.
Here is the joined known variants with PacBio data:
knownmutsSEQ.merge.tsv
knownmutsSEQUENOM.merge.tsv
This 6.0e-08 threshold yields all SEQUENCING variants and all SEQUENOM
variants except 8.
Here are the missed SEQUENOM variants at the 6.0e-08 threshold:
----
key SampleID TestGroup PtInitials CollDate Muts Frac
42 2450177-0021.F1 g250e 2 1 laj 1/6/05 g250e x%
44 2450177-0021.F1 l248v 2 1 laj 1/6/05 l248v x%
85 2450177-0024.F6 f359c 15 1 map 6/6/05 f359c x%
104 2450177-0025.F1 m244v 10 1 ksb 30/3/05 m244v x%
161 2450177-0027.F0 l248v 17 1 sp 23/6/05 l248v x%
206 2450177-0029.F4 t315i 66 4 mz 26/7/06 t315i x%
279 2450177-0034.F2 m351t 89 4 lys 27/5/05 m351t x%
289 2450177-0034.F6 v299l 93 4 dvd 11/1/07 v299l x%
runbc one poi coi Qcodon fracNull countNull SNull fracQAtP
42 2450177-0021.F1 1 250 ggg gag 0.00028 8 28889 0.00469
44 2450177-0021.F1 1 248 ctg gtg 0.00010 1 10000 0.00240
85 2450177-0024.F6 1 359 ttc tgc 0.00022 4 18461 0.00317
104 2450177-0025.F1 1 244 atg gtg 0.00010 1 10000 0.00687
161 2450177-0027.F0 1 248 ctg gtg 0.00010 1 10000 0.00172
206 2450177-0029.F4 1 315 act att 0.00392 164 41835 0.00999
279 2450177-0034.F2 1 351 atg acg 0.00026 11 41782 0.00850
289 2450177-0034.F6 1 299 gtg ttg 0.00028 12 42241 0.00450
countQAtP SQAtP pval mutation limsID barcode Sample.ID key2
42 10 2132 6.28e-08 g250e 2450177-0021 F1 2 2 g250e
44 7 2918 1.94e-04 l248v 2450177-0021 F1 2 2 l248v
85 4 1263 9.61e-04 f359c 2450177-0024 F6 15 15 f359c
104 8 1164 1.17e-07 m244v 2450177-0025 F1 10 10 m244v
161 7 4074 1.02e-03 l248v 2450177-0027 F0 17 17 l248v
206 19 1901 7.25e-04 t315i 2450177-0029 F4 66 66 t315i
279 5 588 2.03e-06 m351t 2450177-0034 F2 89 89 m351t
289 9 2002 1.45e-07 v299l 2450177-0034 F6 93 93 v299l
----
There is the possibility that a 6.0e-08 threshold is too stringent and
that a larger, more-lenient threshold would have good
performance. However, we would have to validate a larger number of
predictions to see if they are true or false positives. Also, we can
possibly boost statistics by combining technical repeat runs together.
novel variants
Taking the more strict pvalue threshold of 6e-08, I see 485 novel
variants (327 non-silent) that occur in BOTH technical repeat chips
occuring with abundances 0.2% to
86.15%. novelPacBioVariants.tsv.xls
Here is a large abundance novel variant in both technical repeats:
key one poi coi Qcodon fracNull countNull SNull
98846 2450177-0034.F2 t240a 1 240 acg gcg 0.00015 6 41248
104291 2450177-0035.F2 t240a 1 240 acg gcg 0.00015 6 41248
fracQAtP countQAtP SQAtP pval mutation limsID barcode Sample.ID
98846 0.86150 734 852 0 t240a 2450177-0034 F2 89
104291 0.86089 854 992 0 t240a 2450177-0035 F2 89
key2
98846 89 t240a
104291 89 t240a
A next step is to validate these novel variants to see if they are
real.
One can also allow for significant variants that don't occur in both
technical repeat chips. This might identify some very low abundance
variants.
----
Note that in order to simplify results, I took the most significant
technical repeat and multiple codon encoding.
Here is a case where a f317l is spread across multiple codons:
key SampleID TestGroup PtInitials CollDate Muts Frac
250 2450177-0036.F2 f317l 97 4 eec 27/12/05 f317l 30%
251 2450177-0036.F2 f317l 97 4 eec 27/12/05 f317l 30%
252 2450177-0036.F2 f317l 97 4 eec 27/12/05 f317l 30%
253 2450177-0036.F2 f317l 97 4 eec 27/12/05 f317l 30%
runbc one poi coi Qcodon fracNull countNull SNull fracQAtP
250 2450177-0036.F2 1 317 ttc tta 1e-04 2 19818 0.38975
251 2450177-0036.F2 1 317 ttc ctc 1e-04 1 10000 0.20143
252 2450177-0036.F2 1 317 ttc cta 1e-04 1 10000 0.00358
253 2450177-0036.F2 1 317 ttc ttg 1e-04 1 10000 0.00596
countQAtP SQAtP pval mutation limsID barcode Sample.ID
250 327 839 0.00e+00 f317l 2450177-0036 F2 97
251 169 839 6.30e-180 f317l 2450177-0036 F2 97
252 3 839 1.76e-03 f317l 2450177-0036 F2 97
253 5 839 1.58e-05 f317l 2450177-0036 F2 97
In this case, a single codon = 39% abundance but two codons=59%
abundance.
compound mutations
We can look at how mutations occur compounded together because we
sequence a continuous 862-base region from single molecules.
Here is a summary of all compound mutations: bcrabl.compoundvariants.runs20-21c24-37.tsv.xls
For this summary, any mutation seen 10 or less times is not trusted
and discarded from compound mutation analysis.
Among 47 samples where >1 mutation was detectable by direct sequencing
or MassARRAY, SMRT sequencing revealed that 40 (85%) had compound
mutations detectable at a frequency of >1%. In total, we detected 73
different compound mutations at a frequency of ≥1%. In all cases
where compound mutations were detected and more than one treatment
timepoint was available, at least one compound mutation clearly
evolved from a mutation detectable at a prior timepoint. In the most
complex case, 4 separate mutations yielded 8 different mutant alleles.
time evolution
Patient CSY has 3 time points: F3=22/1/08, F2=28/3/06, F1=21/3/05 in
run 2450177-0032.
Show all compound mutations greater than 1% abundance:
---- F1:
26 0.010874 p230p.cca,f359c.tgc
606 0.253450
1325 0.554161 f359c.tgc
---- F2:
58 0.023529 t315i.att,f359c.tgc
334 0.135497
1006 0.408114 f359c.tgc
---- F3:
21 0.010479 t315i.att,a350a.gct,e352d.gat
21 0.010479 t315i.att,a350a.gct
36 0.017964 t315i.att,e352d.gat,f359c.tgc
65 0.032435
78 0.038922 t315i.att,a350a.gct,f359c.tgc
118 0.058882 t315i.att,a350a.gct,e352d.gat,f359c.tgc
140 0.069860 f359c.tgc
244 0.121756 t315i.att
903 0.450599 t315i.att,f359c.tgc
In 2005 there is a f359c mutation (55%). In 2006, there is also a 2%
t315i.att,f359c.tgc. In 2008, t315i.att,f359c.tgc domainates (45%),
followed by t315i (12%), and f359c (7%).
Perhaps this could have been caught in 2006 rather than 2008.
t315i compound mutations
Here are all mutations that compound with t315i at greater than 1%,
where the integer indicates the number of chips runs where the
compound mutation was observed.
1 d276e.gag,t315i.att
1 t315i.att,a350a.gct
1 t315i.att,d482d.gat
2 e255v.gtg,t315i.att
2 g250e.gag,t315i.att
2 t315i.att,a350a.gct,e352d.gat
2 t315i.att,a350a.gct,e352d.gat,f359c.tgc
2 t315i.att,a350a.gct,f359c.tgc
2 t315i.att,e352d.gat,f359c.tgc
2 t315i.att,f359v.gtc
2 t315i.att,h396r.cgt
2 t315i.att,m351t.acg
2 t315i.att,m458i.att
2 t315i.att,s417y.tac
2 t315i.att,w478l.ttg
2 y253h.cac,t315i.att
4 e255k.aag,t315i.att
4 e279k.aag,t315i.att
4 t315i.att,f359c.tgc
29 t315i.att
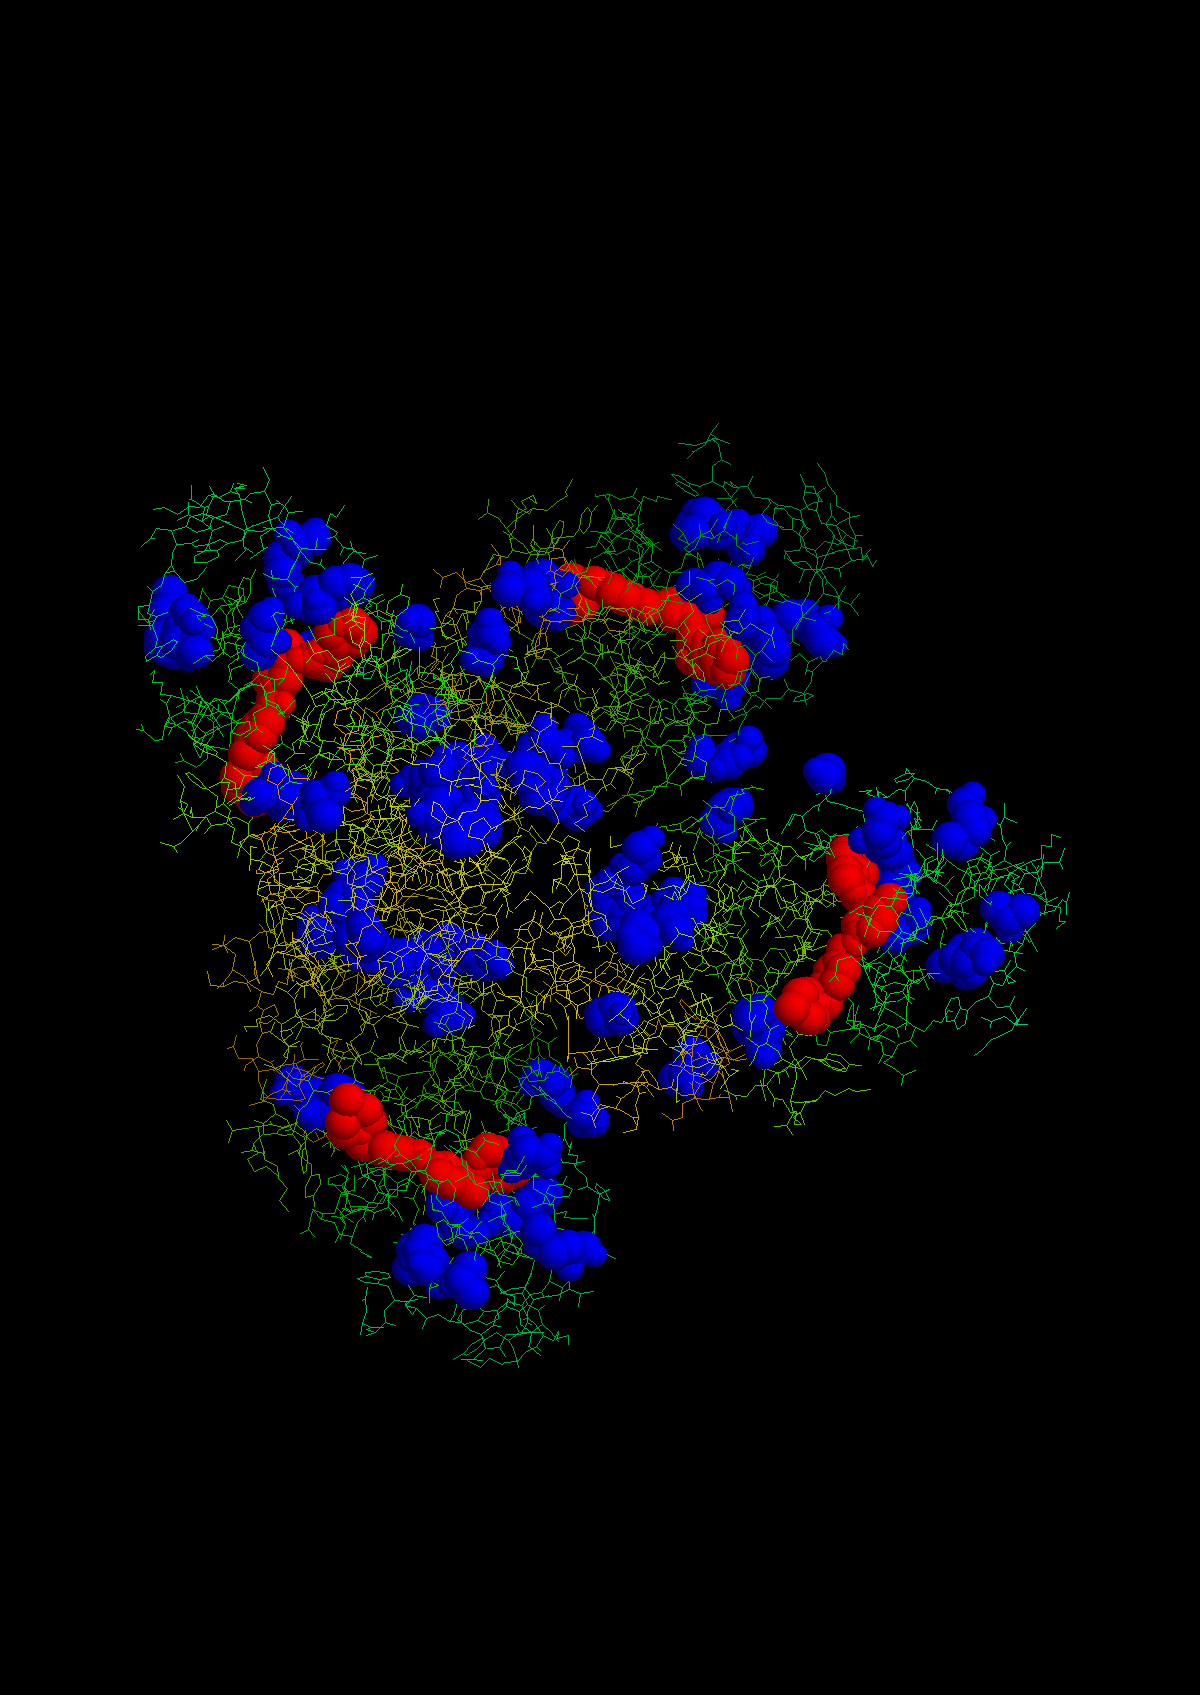
We can also highlight the most commonly independently observed
mutations in the 2HYY structure:
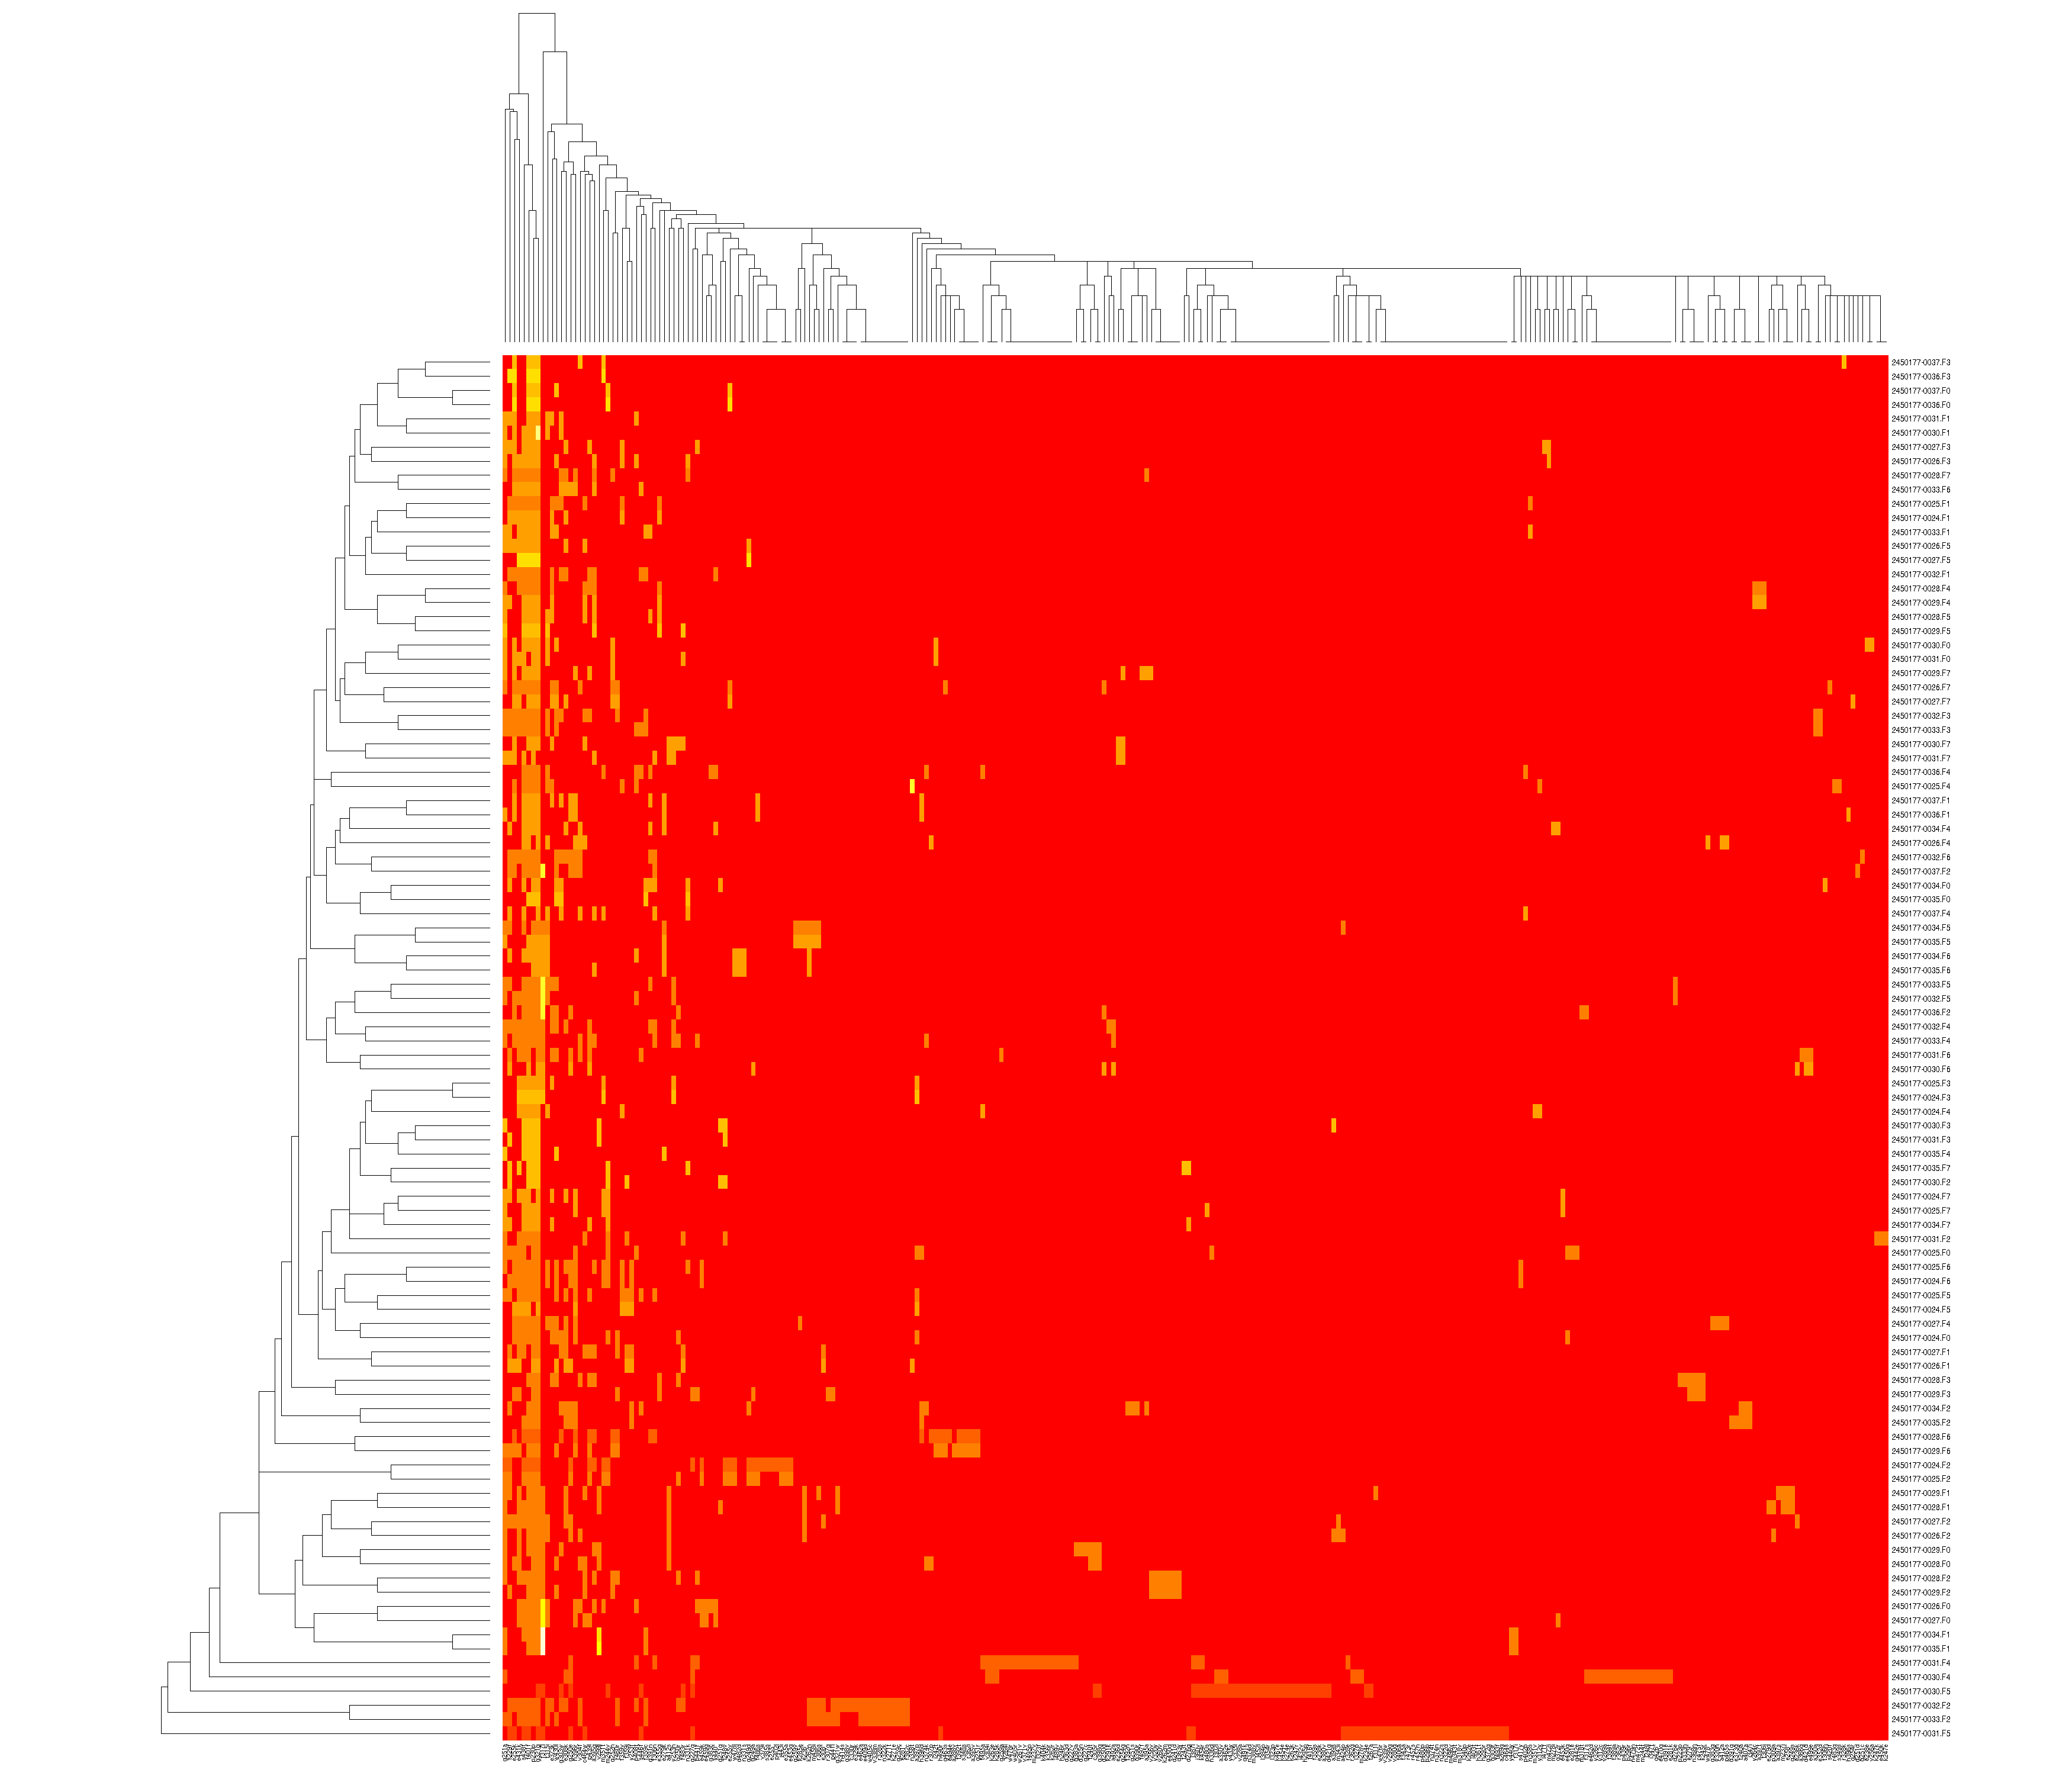
 You can also look at how samples and variants co-occur:
future: mutual information, structural variants, CLIA test
To determine the dependence on one variant to another, we can compute
mutual information between all pairs. This quantifies whether one
variant always occurs with another but might be hindered by smaller
sample size.
This analysis examined amino-acid variants to a known reference. We
have also observed more structural events like ~150-base deletions in
the reads. A characterization of these structural events to clinical
status might be very interesting.
The PacBio assay appears to have sensitivity comparable to SEQUENOM
and SEQUENCING and additionally gives the entire 862-base
domain. Would this be a valuable clinical CLIA-type assay?